
What Mobility Measure is Most Important?
Welcome to Smart Mobility Spotlight, Imagry’s newsletter delivering the latest in autonomous driving and smart mobility solutions. Subscribe to stay informed with curated insights, expert perspectives, and emerging trends in the ever-evolving world of transportation.
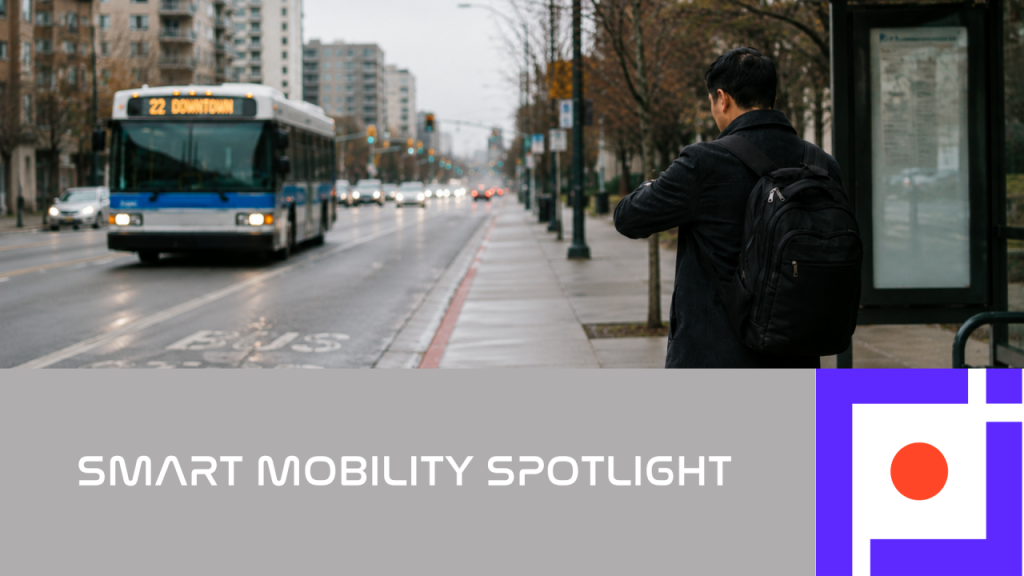
| Key Takeaways: • Why does measuring access in minutes rather than distance change what public transport is expected to deliver? • What’s the difference between proximity, accessibility, and transport performance — and who is responsible for each? • Why do passengers on the urban periphery pay a “double punishment,” and which part of it can transport actually fix? • Why does a single transfer cost more than the distance it covers? • How can automation increase mobility without requiring modifications to existing infrastructure? |
Conquered Distance, Lost Time:
What Mobility Measure is Most Important?
Ask a transport authority how good its network is, and the answer usually comes as a measure of coverage: length of the line, number of stops, share of the population within a specific distance of a service. These are real numbers, and they’re what most systems are built to report. But they describe what exists, not what a person can actually use. A stop three blocks from home that’s served four times a day is close on a map but out of reach in practice. The real gap is measured in a different unit — the one travelers actually feel: time.
That unit has been moving toward the center of the urban planning conversation for several years, most visibly through the “15-minute city” — a concept first proposed by Carlos Moreno in 2016. Which raises a question worth examining more closely: if access is measured in minutes rather than meters, what does that change about what public transport is expected to deliver?
⏱️ The Least Important Part of the 15-Minute City Is the Number
The 15-minute city is the proposal that residents should be able to reach most of what daily life requires, work, schooling, healthcare, shopping, and green space, within a short walk or cycle of home. Since Anne Hidalgo adopted it during her Paris mayoral campaign more than six years ago, it has become one of the most discussed and most contested ideas in global urbanism.
In a recent interview with New Polis Carlos Moreno, the professor who introduced the concept, revisits it almost two decades after first proposing it. His opening statement is to take attention away from the figure in the name. The least important element of the model, he says, is the number itself. What matters is the relationship between urban space and useful time. Cities spent the second half of the twentieth century conquering long distances and lost useful time in the process. His summary of the challenge ahead is compact: “We have conquered distance, but the real challenge now is to reclaim time.”
The number has moved accordingly. Scotland works with a 20-minute territory, Utrecht with 10 minutes, and Spain applies a 30-minute model to its medium and smaller cities. The more spread out the settlement, the larger the number, which is an admission built into the concept: where homes and services sit far apart, a short walk cannot reach the same amount of daily life, and whatever it cannot reach has to be reached some other way. That is where public transport enters the conversation. But turning “access in minutes” into a planning device for operators requires separating a few measures that usually travel under the same word.
🧭 Proximity, Accessibility, and the Difference Between Them
Proximity, accessibility, and transport performance are often used interchangeably, and they describe different things. The ITF – International Transport Forum at the OECD set them apart in its report “Benchmarking Accessibility in Cities”, a study of 121 cities across 30 European countries:
- Proximity: how many destinations are physically near a person
- Accessibility: how many of those destinations that person can actually reach within a given time, using a given mode of transportation
- Transport Performance: how well the mode converts the first into the second
The distinction matters because it assigns responsibility to different actors. Proximity depends on where housing, schools, clinics, and workplaces are located, which is a planning decision and changes only when something is built. Transport performance depends on how often a service runs, how late it operates, and how well its connections are timed, which is an operational decision. Two neighborhoods can look identical on a coverage map and be very different places to live, if one is served every ten minutes and the other once an hour. Which raises the question: what happens to the neighborhoods where proximity cannot realistically be improved?
⚖️ The Double Punishment
The interview cited above addresses that question directly. Moreno turns to the populations for whom proximity is least available and describes how they came to evolve. Moreno describes social housing placed on the outskirts, far from services and opportunities. He links this pattern to the fragmented, zoned city inherited from the twentieth century. Residents of those areas, he argues, receive two penalties at once: spatial segregation, meaning being placed far from jobs and services in the first place, and temporal segregation, meaning spending a large share of the day travelling back and forth to them. The consequence he describes is concrete. People without services nearby may spend one, two, or even three hours each day simply reaching work, healthcare, or other basic needs.
Moreno’s own answer is to rebalance the city, distributing social housing and services more evenly. That is a planning response, and by his own account a slow one. But it leaves an open question for the transport sector, because those journeys are being made today. If a resident spends three hours a day traveling, how much of that is fixed by the distance, and how much by the service?
🚏 Where the Time Actually Goes
Distance is only part of what makes a journey long. A public transport trip is made up of several stages: walking to the stop, waiting for the vehicle, riding, sometimes transferring and waiting again, and then walking to the final destination. The total journey time therefore depends not only on how far someone travels, but also on how much time is lost between each stage. Passengers do not experience those minutes equally, and the difference has been measured. A 2022 study in Transport Policy, drawing on evidence from Madrid, Vitoria, and earlier international work, isolated the cost of the transfer itself, separate from the extra walking and waiting a connection requires, and put it at roughly 15 to 18 minutes of riding time. The same body of research finds that a minute spent walking or waiting is generally perceived the same as two to three minutes spent riding.
In other words, a passenger who has to change buses can lose the perceived equivalent of a quarter of an hour before the second vehicle has even arrived, whether the journey ahead is two kilometers or twenty. That burden does not come from the distance. It comes from the timetable. The map looks fine. The clock does not.
📈 Frequency Is an Access Metric
Travel time is not only the time spent moving. For public transport passengers, waiting can make up a significant part of the journey. This means service frequency is not simply a matter of convenience; it can determine how quickly people can reach jobs, healthcare, education and other essential services. A 2024 analysis by the Urban Institute, carried out with the Washington Metropolitan Area Transit Authority, modelled it directly. Increasing frequency on existing bus lines by roughly 35 percent, without adding any new infrastructure, would expand the number of jobs reachable within 30 minutes for the average DC resident by almost 30,000 -– an increase of around 60 percent! The researchers attribute that gain largely to shorter waiting times.
The significance is that the network itself does not have to change. The same routes, stops and destinations become accessible within a shorter period simply because buses arrive more often. In that sense, frequency does not just improve the journey, it expands what the network allows people to reach.
🚌 What Limits Better Service
If more frequent service, longer operating hours, and wider coverage can improve access, the next question is what prevents operators from providing them.
Funding, fleet capacity, infrastructure, and demand all play a role. But one constraint cuts across all three: driver availability. Every additional departure, later service hour, or route extension requires more driver time. As we explored in a previous Imagry newsletter, Ten Commandments, One Question: What Kind of Transport System Are We Building?, driver shortages are already limiting what many operators can provide.
This is where automation can change the operating equation. By reducing the extent to which every additional service hour depends on another available driver, it can give operators more flexibility to run service more frequently, later in the day, and in areas where conventional service may be difficult to sustain. A 2025 modelling study of São Paulo published in Scientific Reports explored this relationship in peripheral neighborhoods with lower service levels, finding that automation could help make additional service more viable by lowering operating costs and enabling service during hours that are difficult to justify under conventional operation.
The distinction matters. Automation does not shorten the physical distance between a passenger and a destination. What it can change is how often service runs, how long it remains available, and where it is practical to operate. If access is measured in minutes, the value of autonomous public transport is therefore not necessarily that the vehicle travels faster. It is whether the service can help passengers spend less of their day waiting and more of it reaching the places they need to go.
🚍 Imagry’s Approach: Autonomy Aimed at Operating Hours
At Imagry Autonomous Buses, we see autonomy as a way to help operators improve the service variables that shape how much time passengers spend traveling: frequency, operating hours, and coverage. The value is not that an autonomous bus necessarily travels faster, but that autonomous operation can make it possible to run service more often, for longer hours, and in places where conventional service may be difficult to sustain.
Our solution offers several advantages for public transport authorities and fleet operators:
- Supports multiple vehicle categories and manufacturers. Imagry’s field-proven hardware-agnostic technology integrates with multiple vehicle platforms for unmatched flexibility.
- AI-based, HD-mapless autonomy. Our system uses real-time, vision-centric perception, with no dependency on HD maps, LiDAR, or cloud connectivity. This enables location independence and use of existing road infrastructure to support fast, scalable deployment.
- Safe, reliable, and trusted globally. Ours is the first autonomous bus to achieve the NCAP safety rating and meet the UN-R155 cybersecurity regulation. We have been operating autonomous vehicles on public roads since 2019 with current projects in the U.S., Germany, Japan, and Israel.
Where destinations cannot be brought closer, better service can bring them closer in time. By helping operators run buses more frequently, for longer hours, and across more of their networks, autonomous public transport can expand the destinations passengers are able to reach within the time they have.
Imagry in the News
Click here to see the latest news and events featuring Imagry’s autonomous driving solutions.
Video Spotlight
The first product of the UNVI – Imagry partnership is this eC22 autonomous bus headed from the UNVI factory in Spain to a deployment in Germany.
Autonomous Mobility Career Opportunities
We’re building more than autonomy. We’re building a team that dares to do what others say is impossible.
We value people who chase hard problems not credit. Who ask better questions. Who stay curious. Who care about the mission, not job titles. And we know that to build the future, we need all kinds of minds.
If that sounds like you, we’d love to meet you.
Want to receive information about automated mobility on a regular basis?
Next stop, full autonomy!
Are you coming? Got a question for us?
Company Locations
1630 Oakland Rd.
Suite #A112
San Jose CA 95131
USA
53 Derekh HaAtsma'ut
5th Floor
Haifa 3303327
Israel